Graphical User Interface
The graphical user interface (GUI) allows you to visually monitor the live data from the sensor.
Set-up
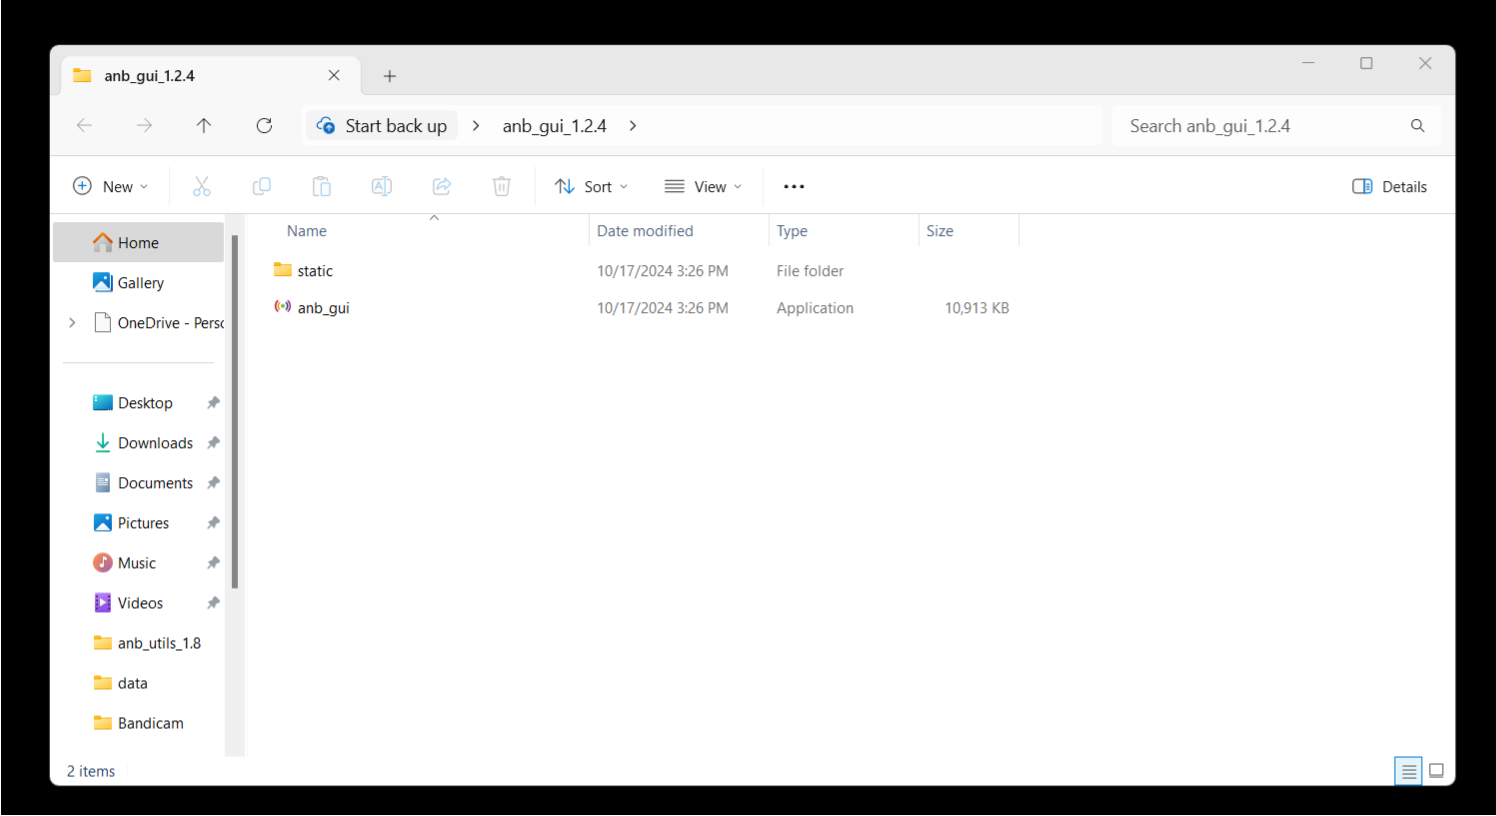
Download the latest anb_gui and unzip to it's own directory.
Ensure you extract the executable to its own directory. Do not run the executable directly from the zip file, as this may cause issues during operation.
Since it uses a serial connection, anb_utils and the GUI cannot be run simultaneously.
Make sure you have the new GUI version, which can be easily recognised by the abrade button (black with white dots) and the reboot button (black with white arrow). In some cases, the web browser may cache the old GUI version, so you might need to refresh the cache.
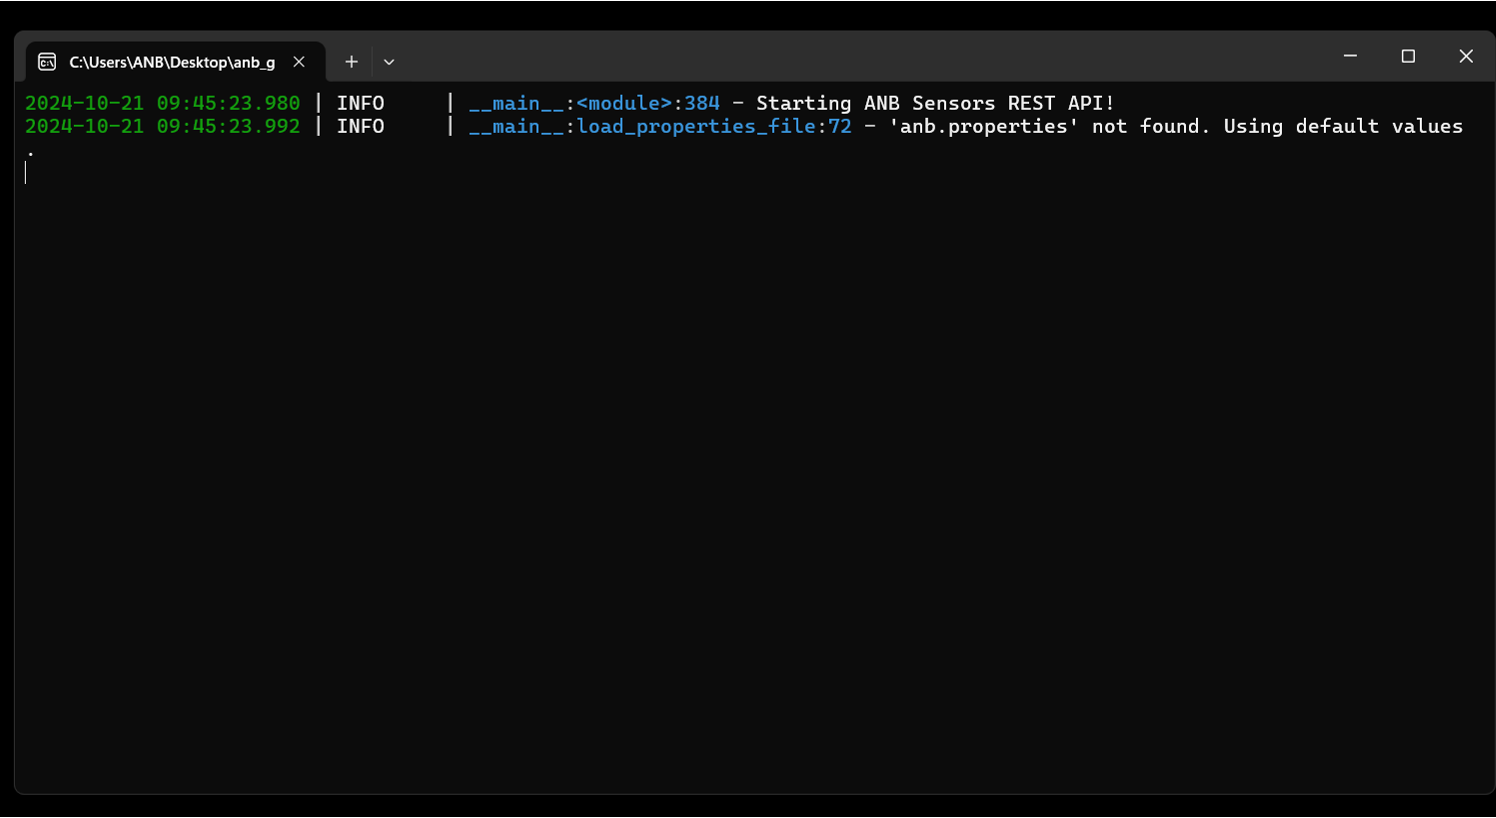
The anb.properties file can contain these properties:
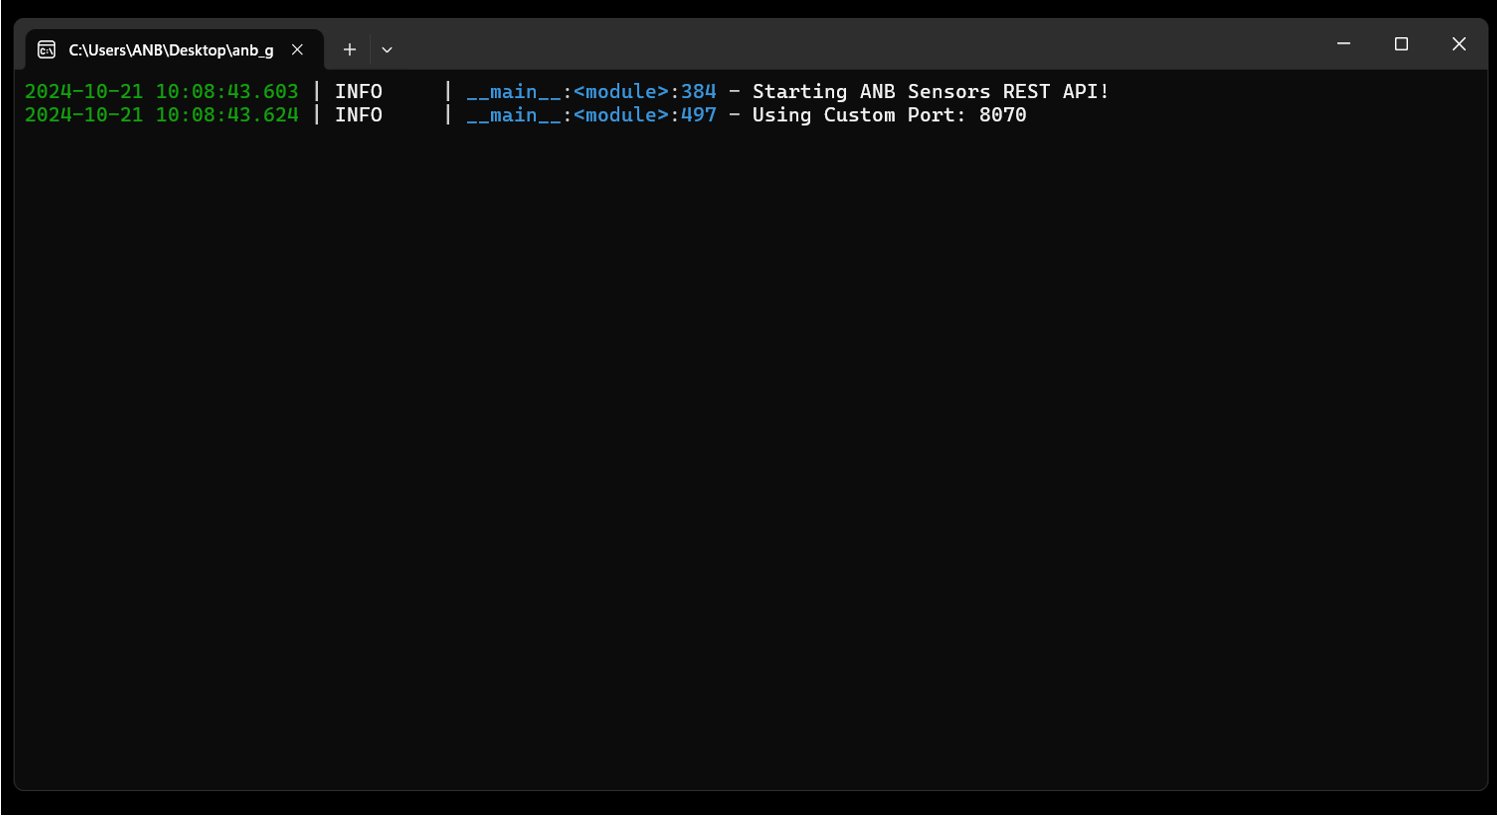
listen_port=
baud_rate=
make sure the file is saved as anb.properties and not anb.properties.txt
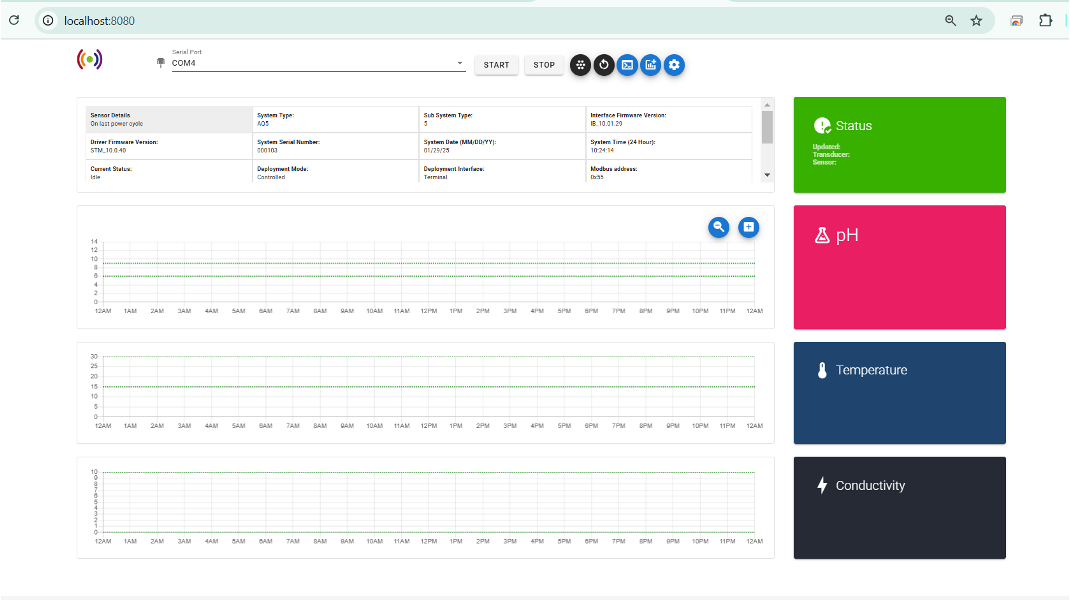
Select your com port and the sensor details (at time of power up) will load.
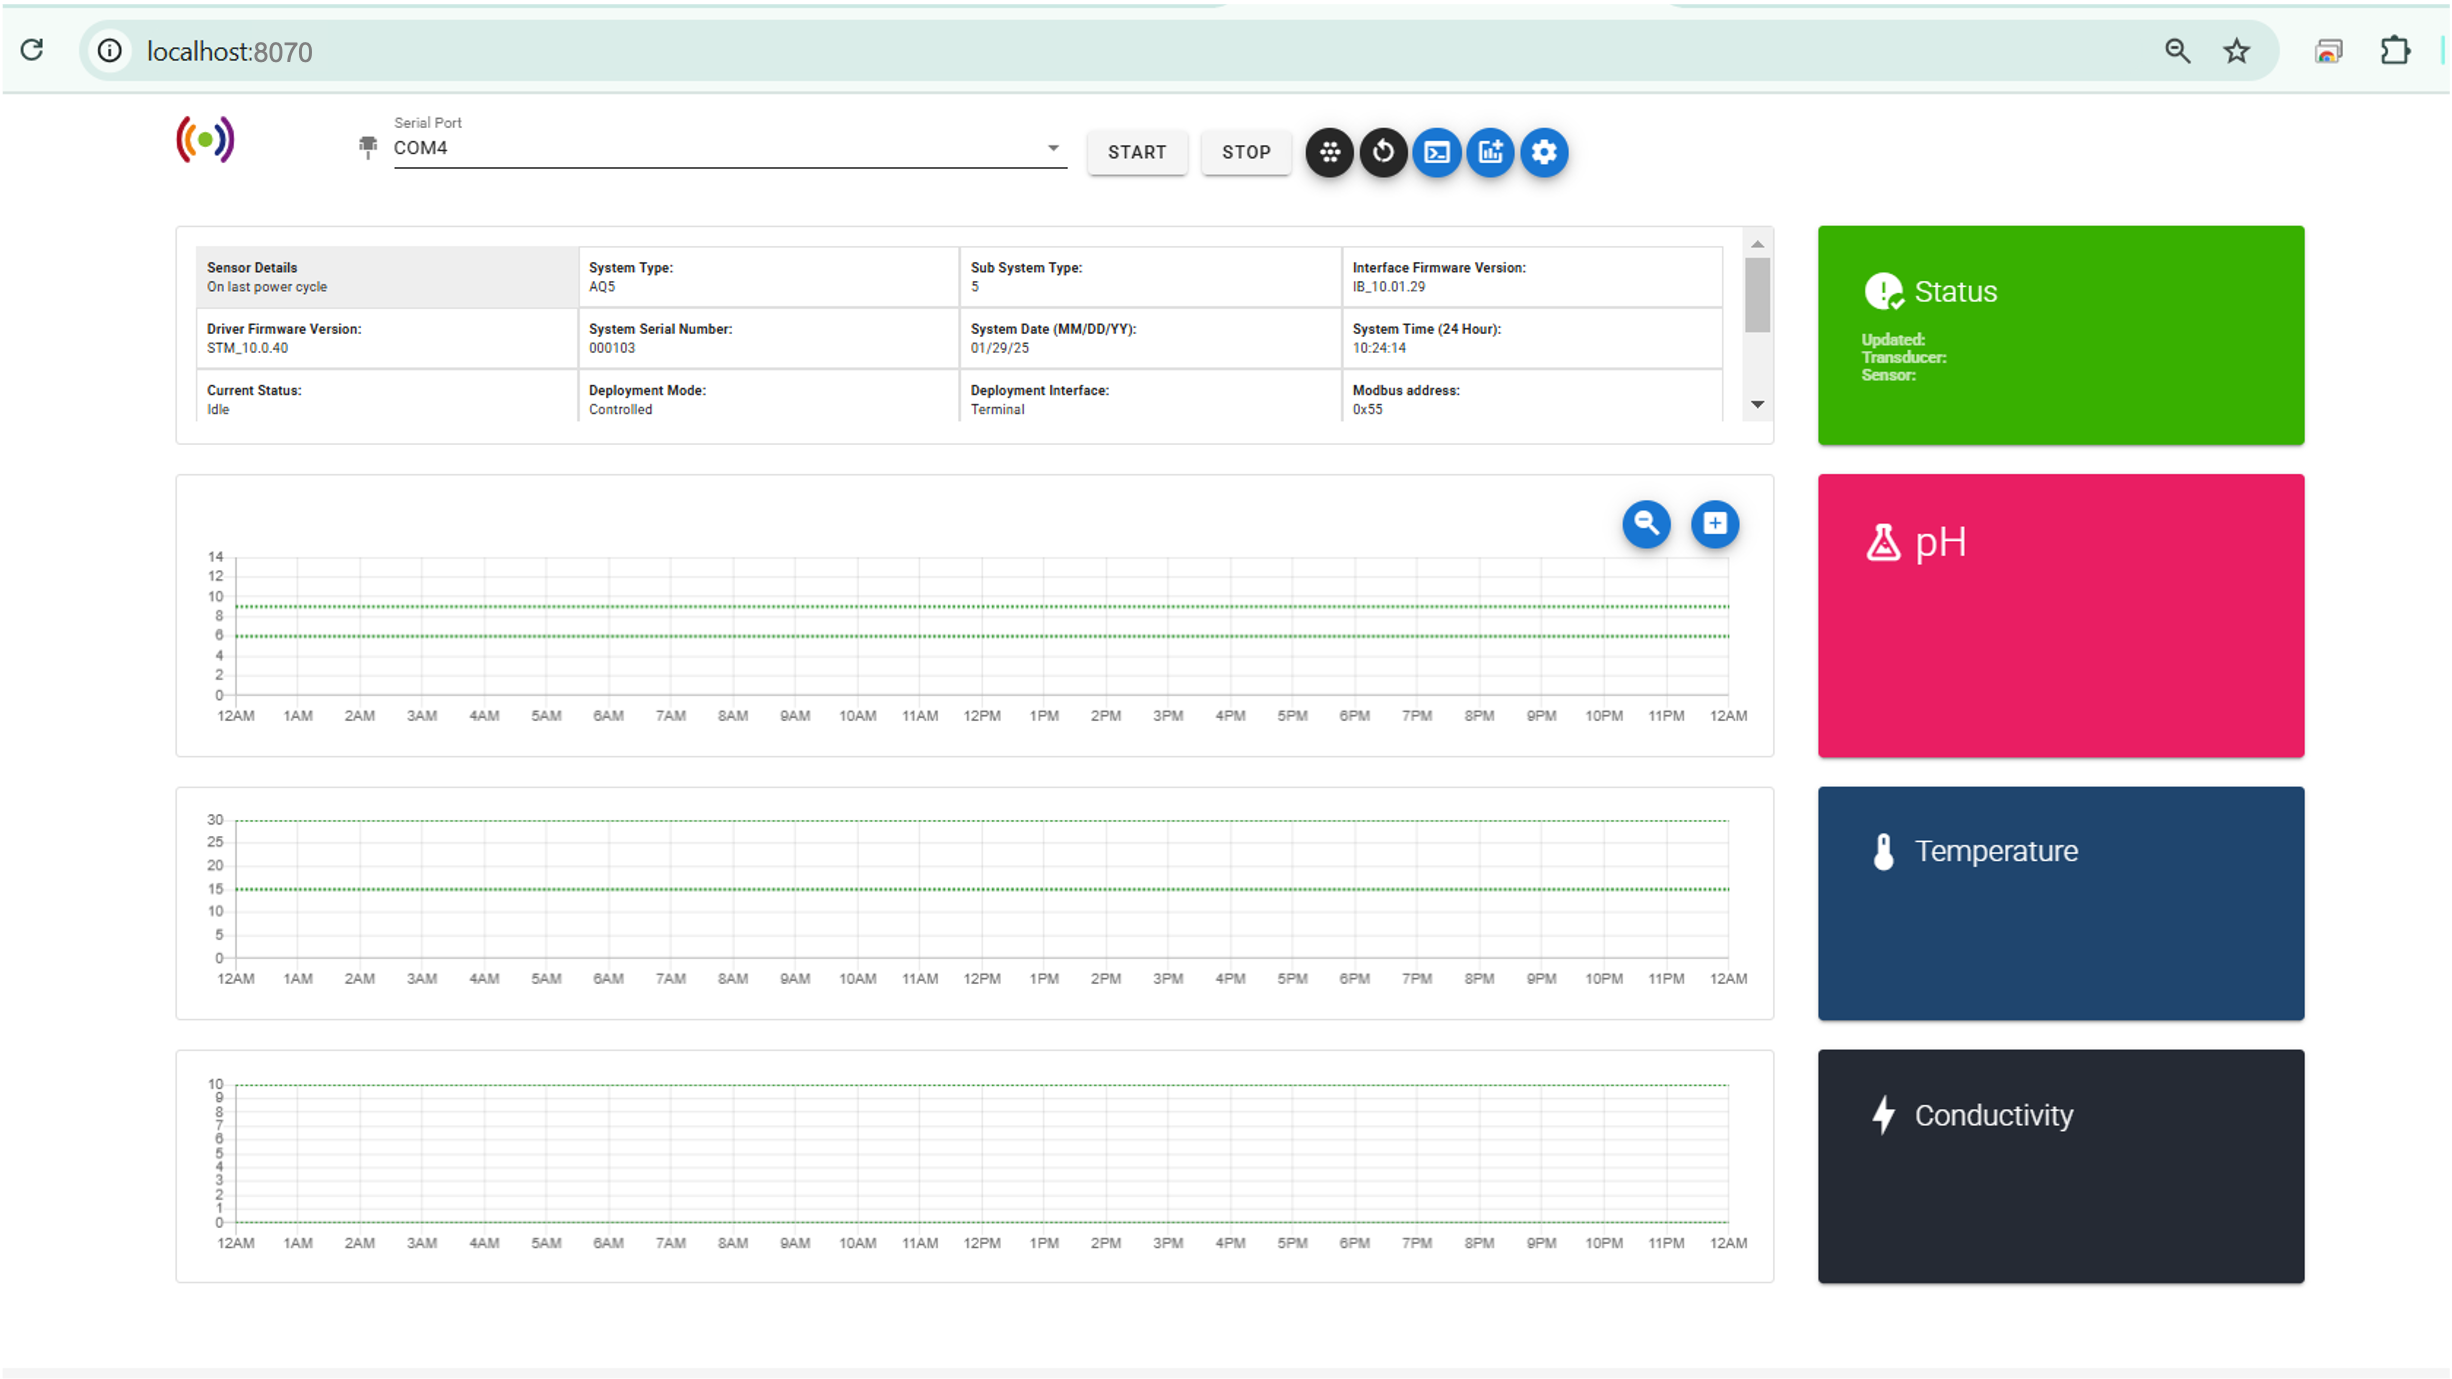
The current status of the sensor and transducer is given in the STATUS box. This shows green if all is well and red if action is required. It then gives you pH, Temperature, Salinity and Conductivity plots, along with the most recent output in the coloured boxes on the right.
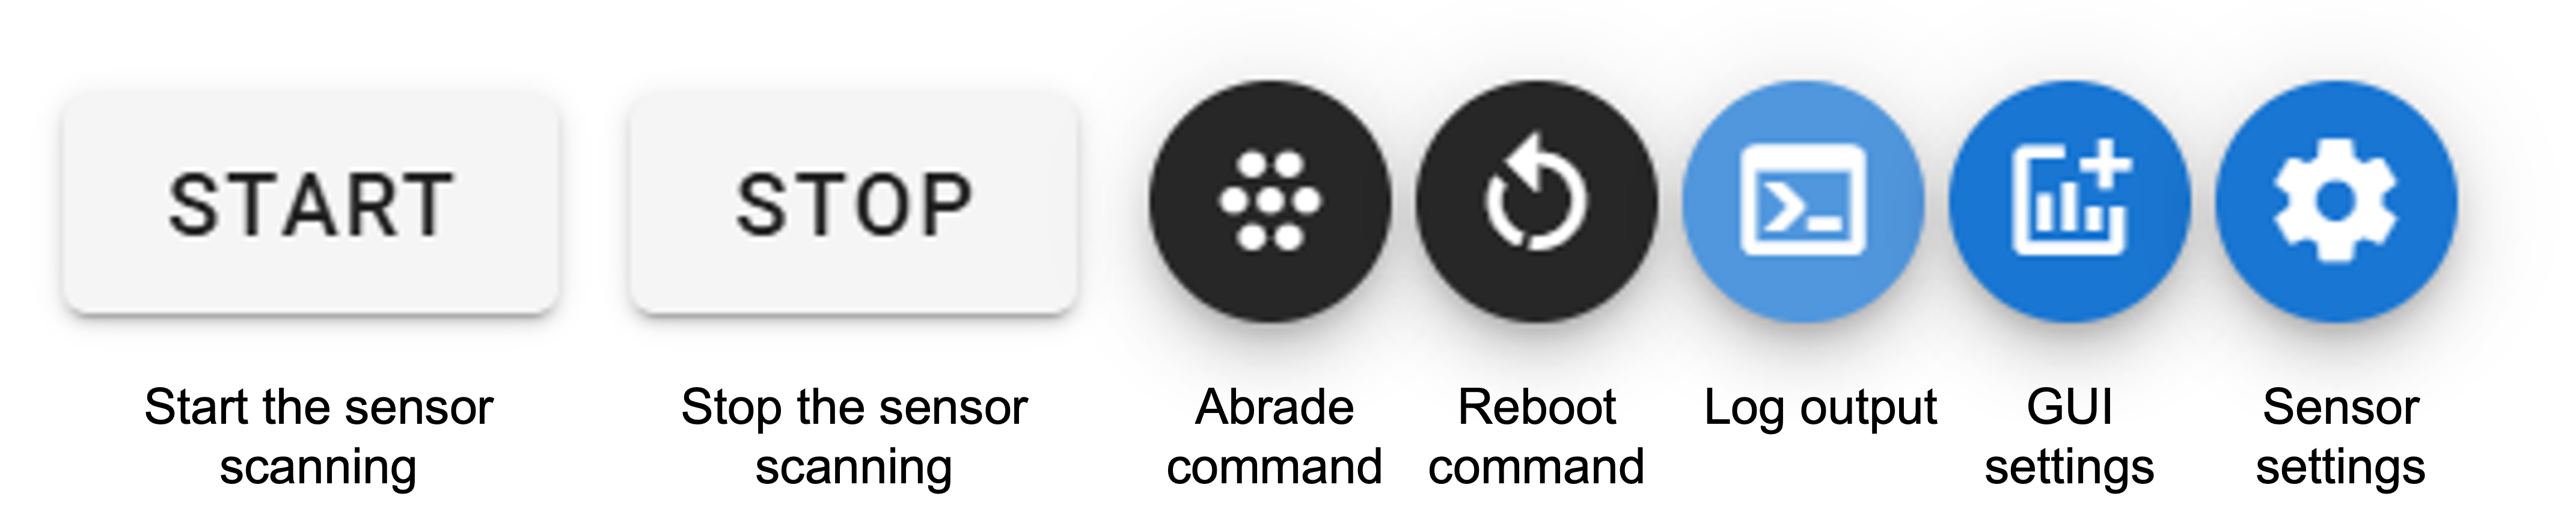
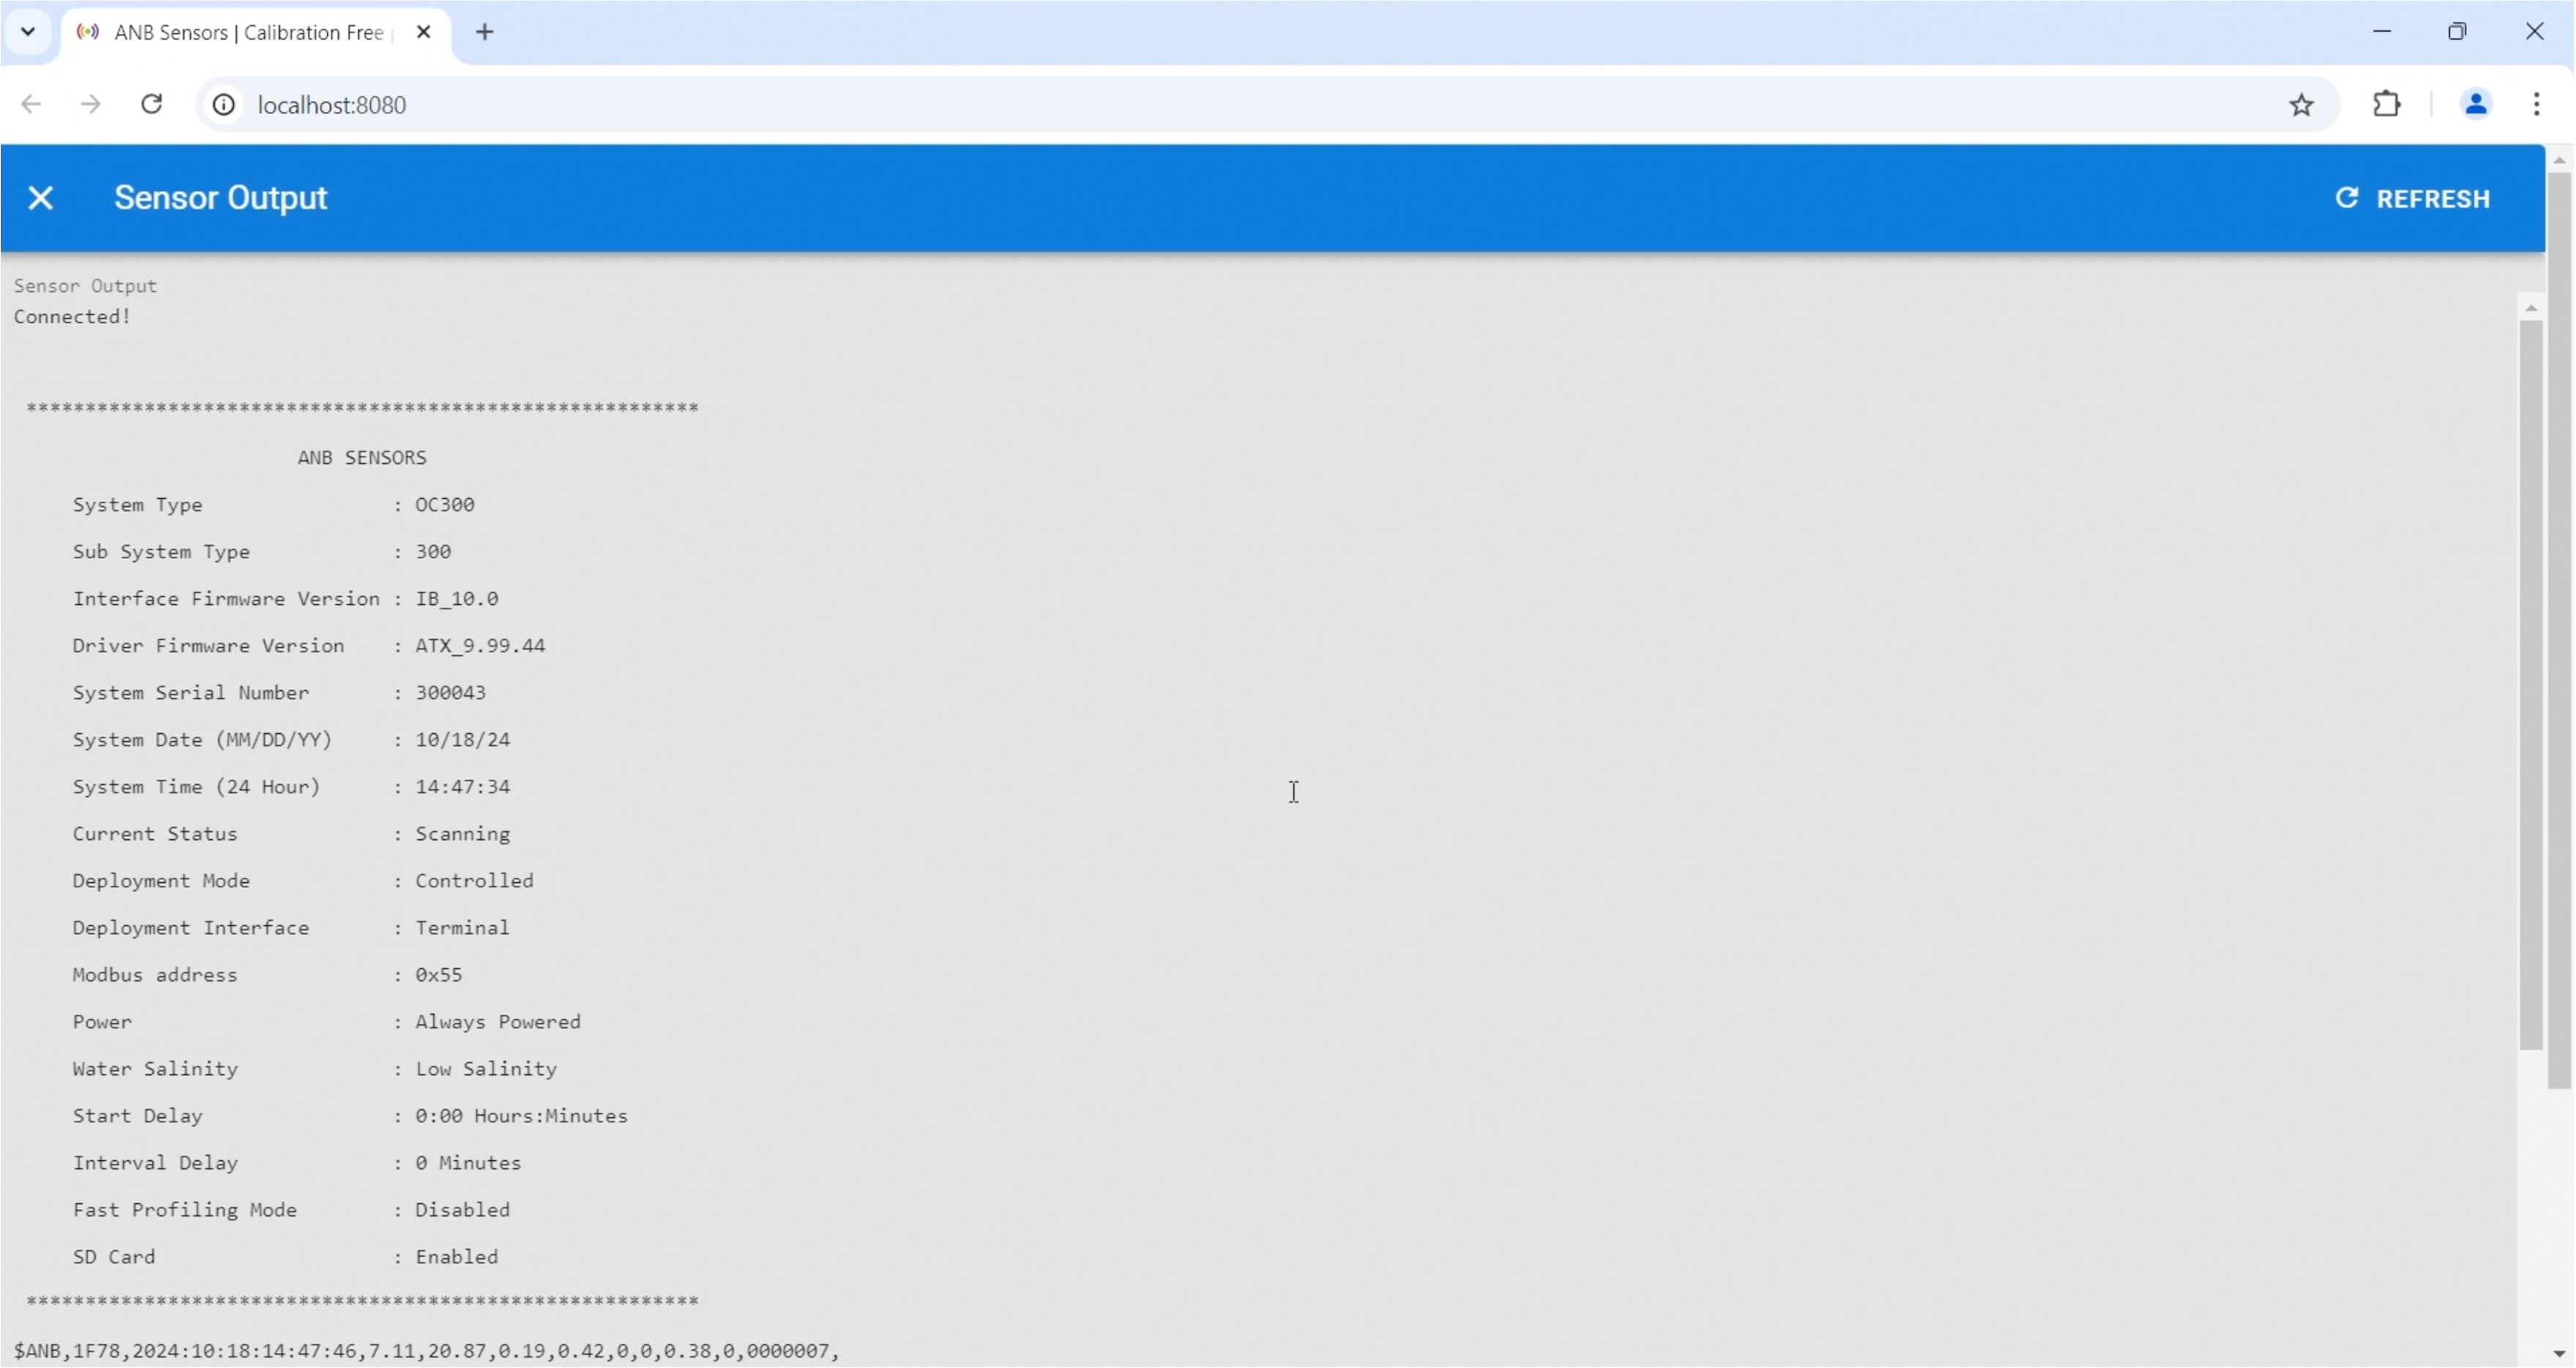
Log Output
- allows you to see the sensors output log
GUI Settings
- allows you to choose which metrics you want to display and set low and high limits to create an alert
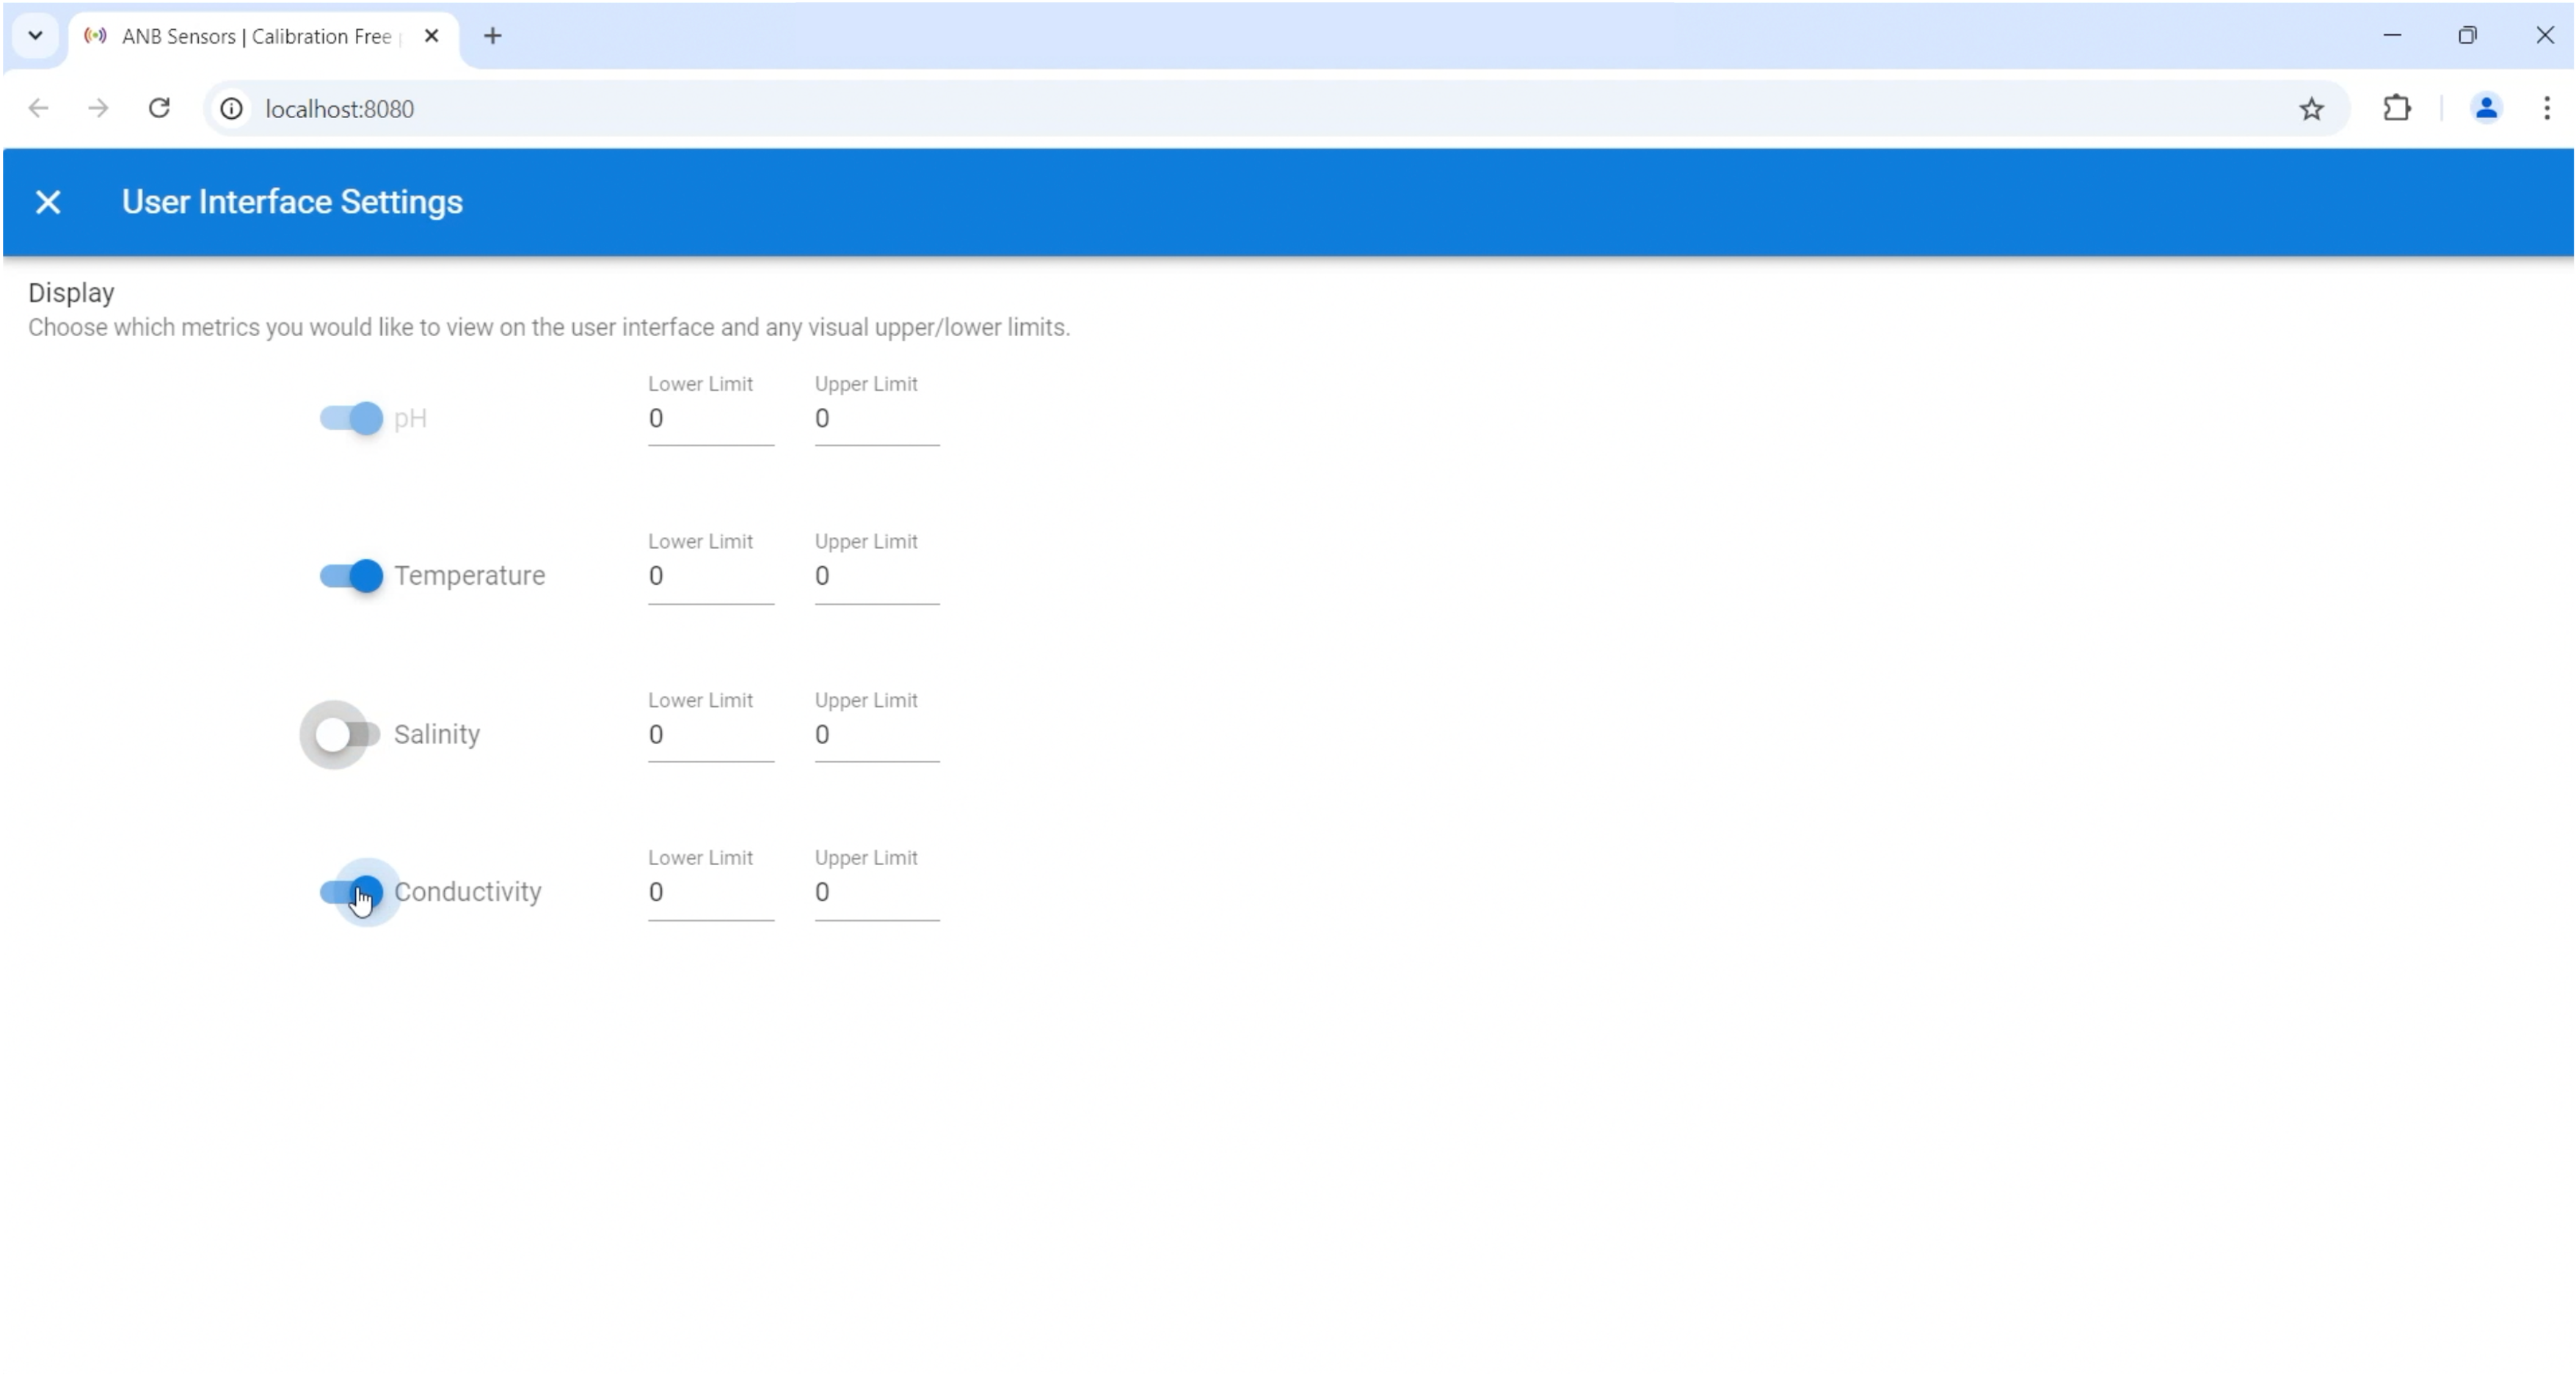
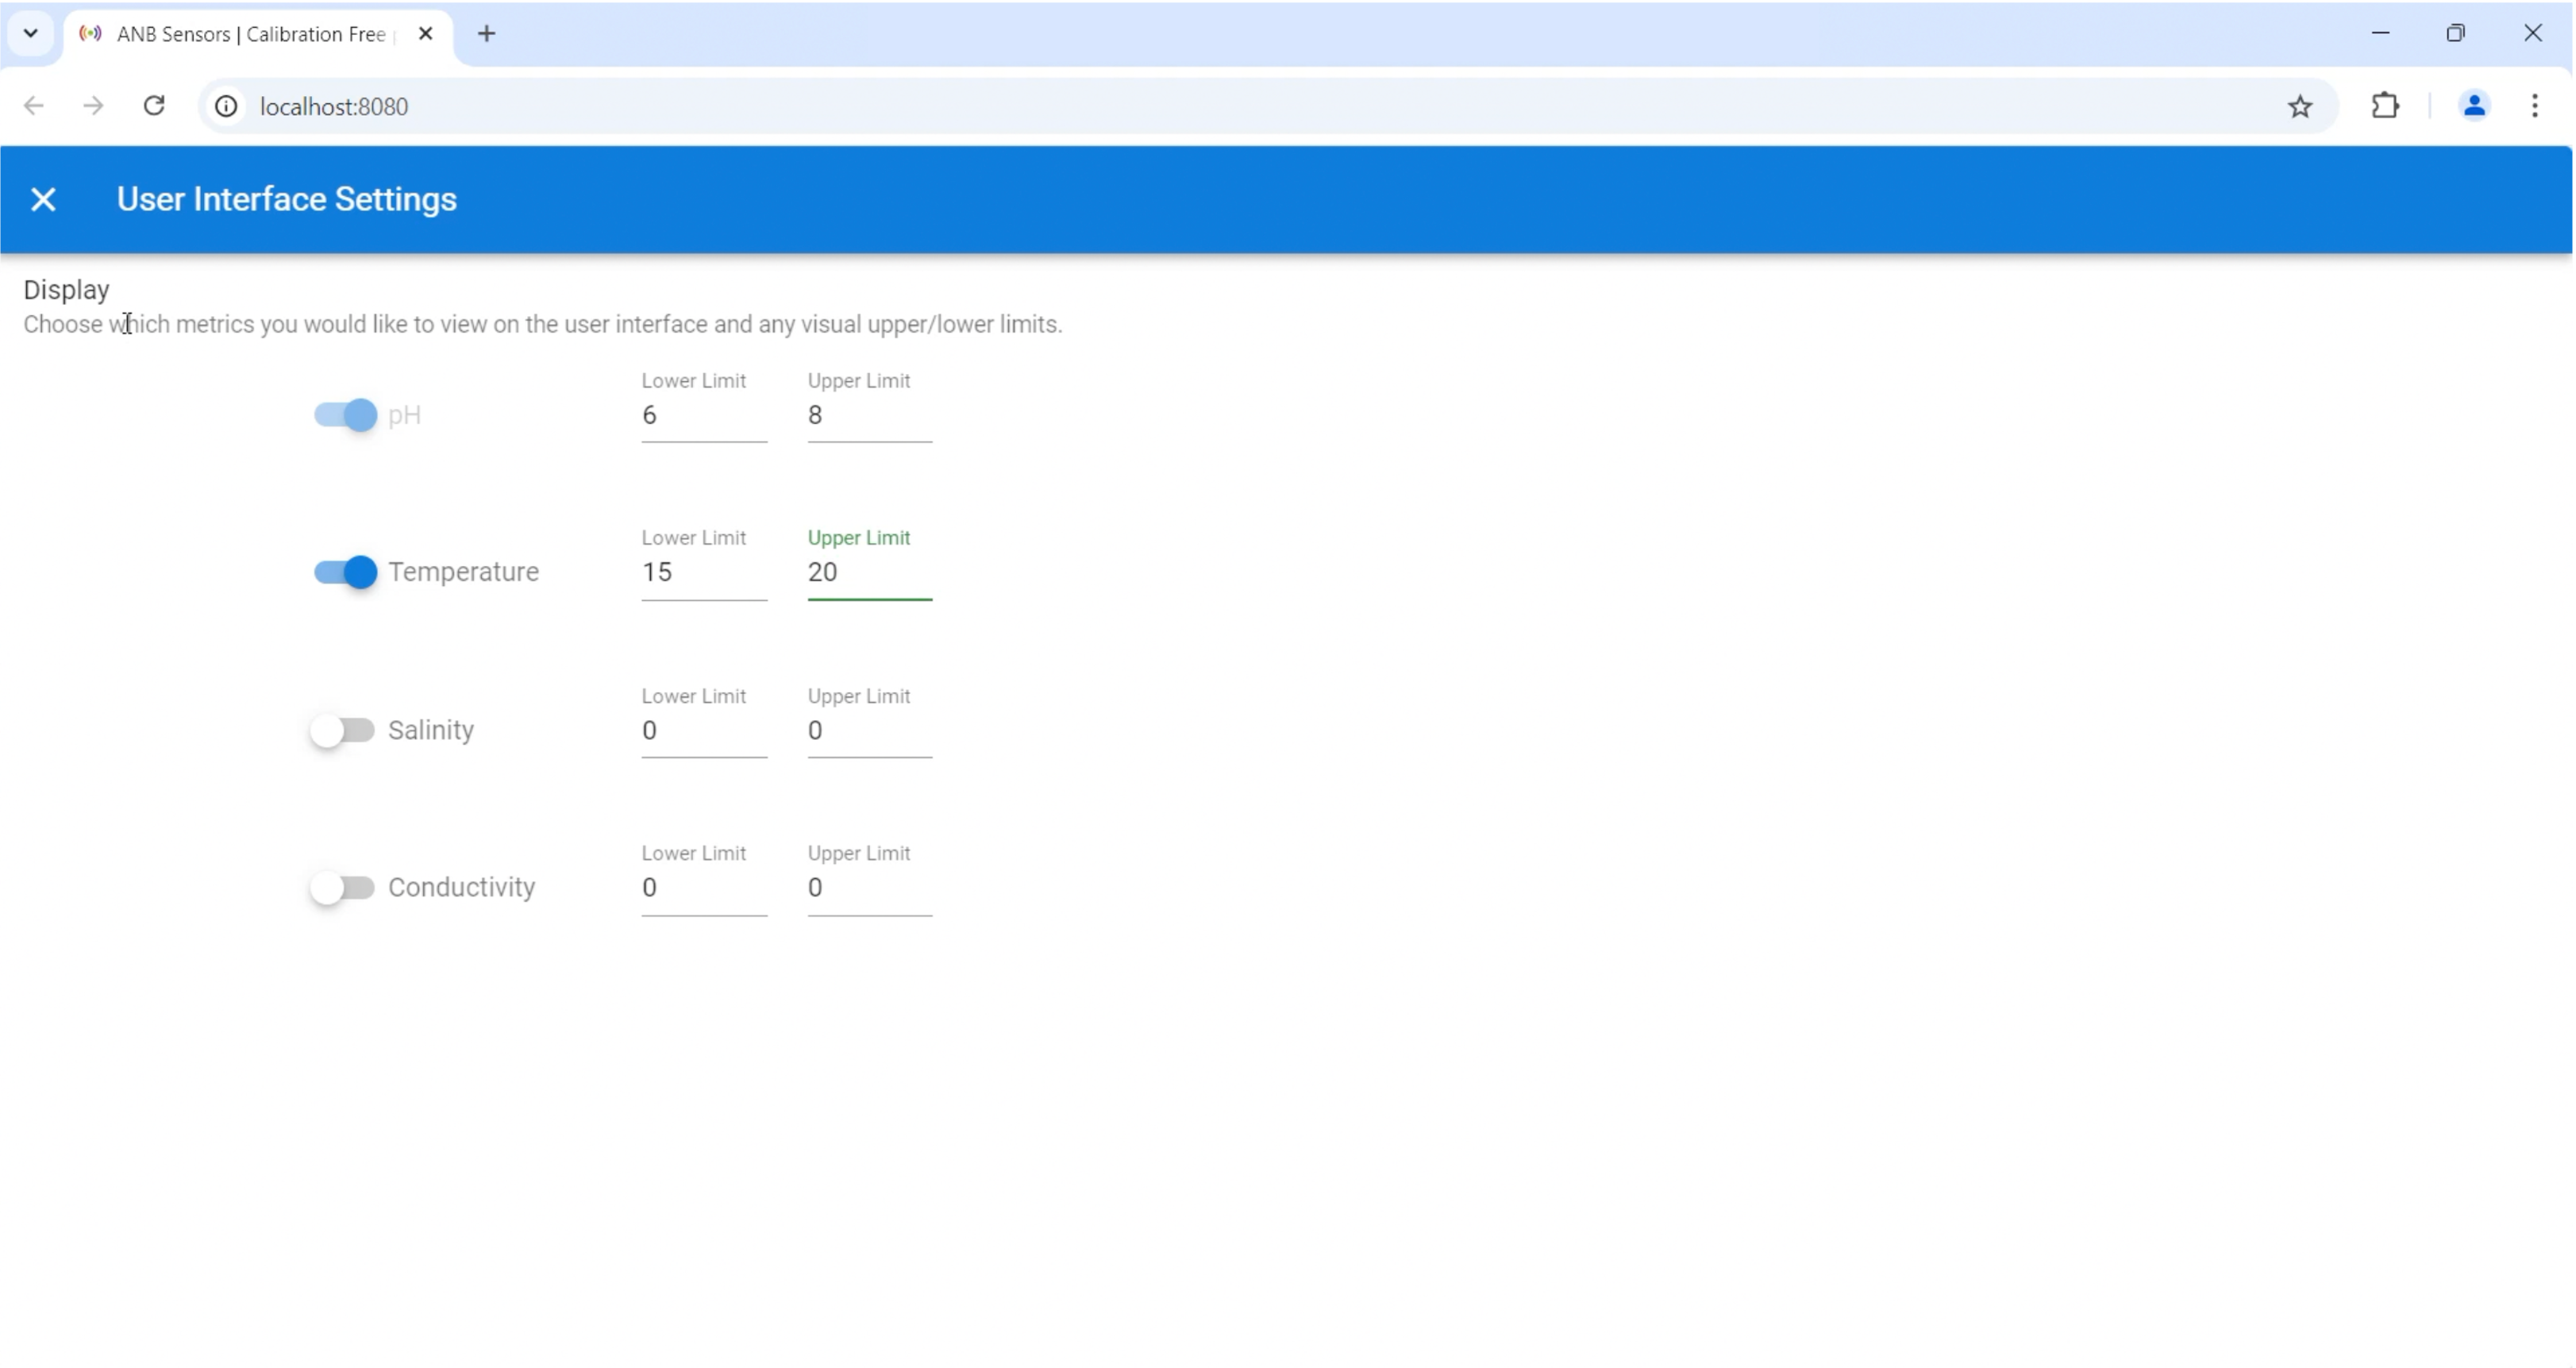
After changing the GUI Settings, please refresh the browser to reset the graphs.
The limits set will show as green lines on the graph, and the alert button will appear if your data is outside them.
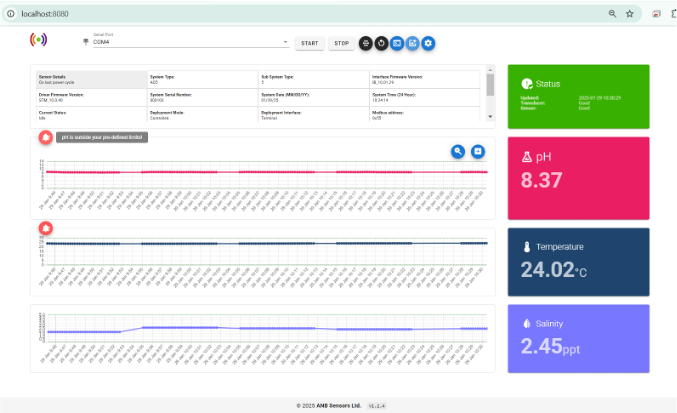
There are two buttons next to the charts that let you zoom in on the data and enlarge the graphs for better visibility.
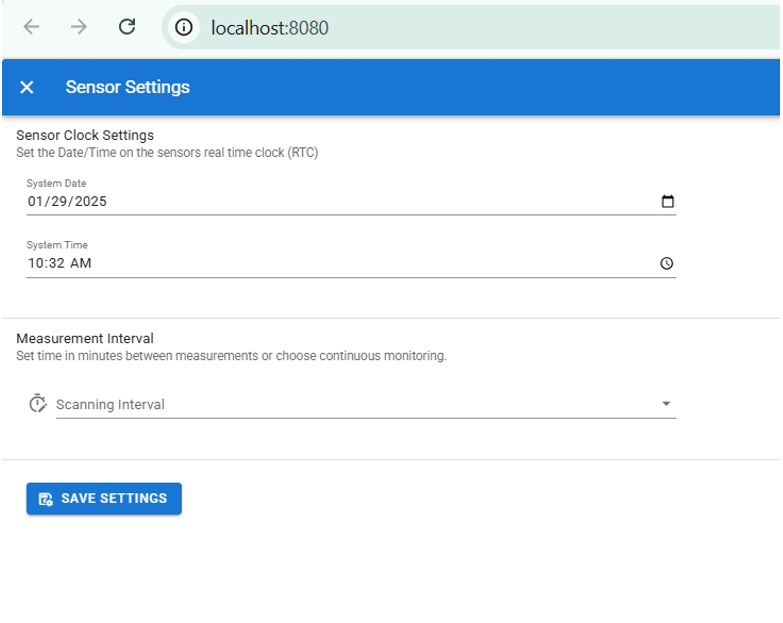
Sensor Settings
- allows you to change the date/time and measurement interval time